How to read a company's quarterly results: a complete guide for investors
Essential Points
- Quarterly results compare market expectations with a company's reality, and that moves the price more than the data itself.
- EPS (earnings per share) is key in the short term, but revenue, EBITDA margin, and free cash flow explain whether the business is truly growing.
- Guidance, the forecast given by the company itself, can have more weight on the price than the results already published.
- Knowing how to read an earnings report and an earnings call does not eliminate risk, but it builds your own judgment instead of just reacting to the headline.
Every quarter, thousands of publicly traded companies publish their earnings reports, and for a few hours, their stock prices move with an intensity unseen at any other time in the stock market. If you've ever seen a stock drop 8% despite announcing record profits, or surge after a seemingly weak quarter, you've witnessed the market's reaction to an earnings report firsthand. Understanding why this happens—and what exactly to look for in that report—is one of the skills that most distinguishes a discerning investor from someone who simply reacts to the headline.
En Bit2Me Academy We explain how to read a company's quarterly results in a structured way: what documents make up a complete earnings report, what EPS means and why it receives so much attention, how to interpret guidance, and what signals to look for when you hear or read an earnings call. This guide is designed for those who already trade equities and want to go beyond simply looking at the price: they want to understand the business behind it.
What are quarterly results and why do they affect a stock's price?
Listed companies are required to publish their financial statements periodically to their market regulator. In the United States, the standard is quarterly, with the well-known Q1, Q2, Q3, and Q4 periods; in Europe, the cycles vary depending on the market and the country, and some companies report quarterly while others report semi-annually. In Spain, the National Securities Market Commission (CNMV) is the body that oversees this obligation of periodic transparency for listed domestic companies.
Quarterly results move the price because a stock's value isn't based on what the company earned yesterday, but rather on what the market expects it to earn in the future. The earnings report is the moment when that collective expectation—the consensus of analysts—is confronted with the reality of the numbers. When both coincide, there's little movement; when they differ, the price readjusts, sometimes sharply.
This is where the concept of "beat or miss" comes in: when a company exceeds consensus estimates (beat), the price tends to rise; when it disappoints them (miss), it tends to fall. The important distinction is that the magnitude of the movement depends not only on the absolute result, but also on what was expected and what expectations were already priced in before the release. A company can earn less than the previous quarter and still rise in the stock market, simply because it earned more than the market had anticipated.
A purely illustrative example helps to solidify the idea: imagine a company that reports EPS of $2,10 when the consensus analyst expectation was $1,90. Even though that earnings per share was lower than the previous quarter, the positive surprise compared to the consensus could drive the price upward. This example is purely illustrative and does not constitute investment advice: the market operates on expectations, not just absolute figures.
The structure of an earnings report: what documents it contains and how to access them
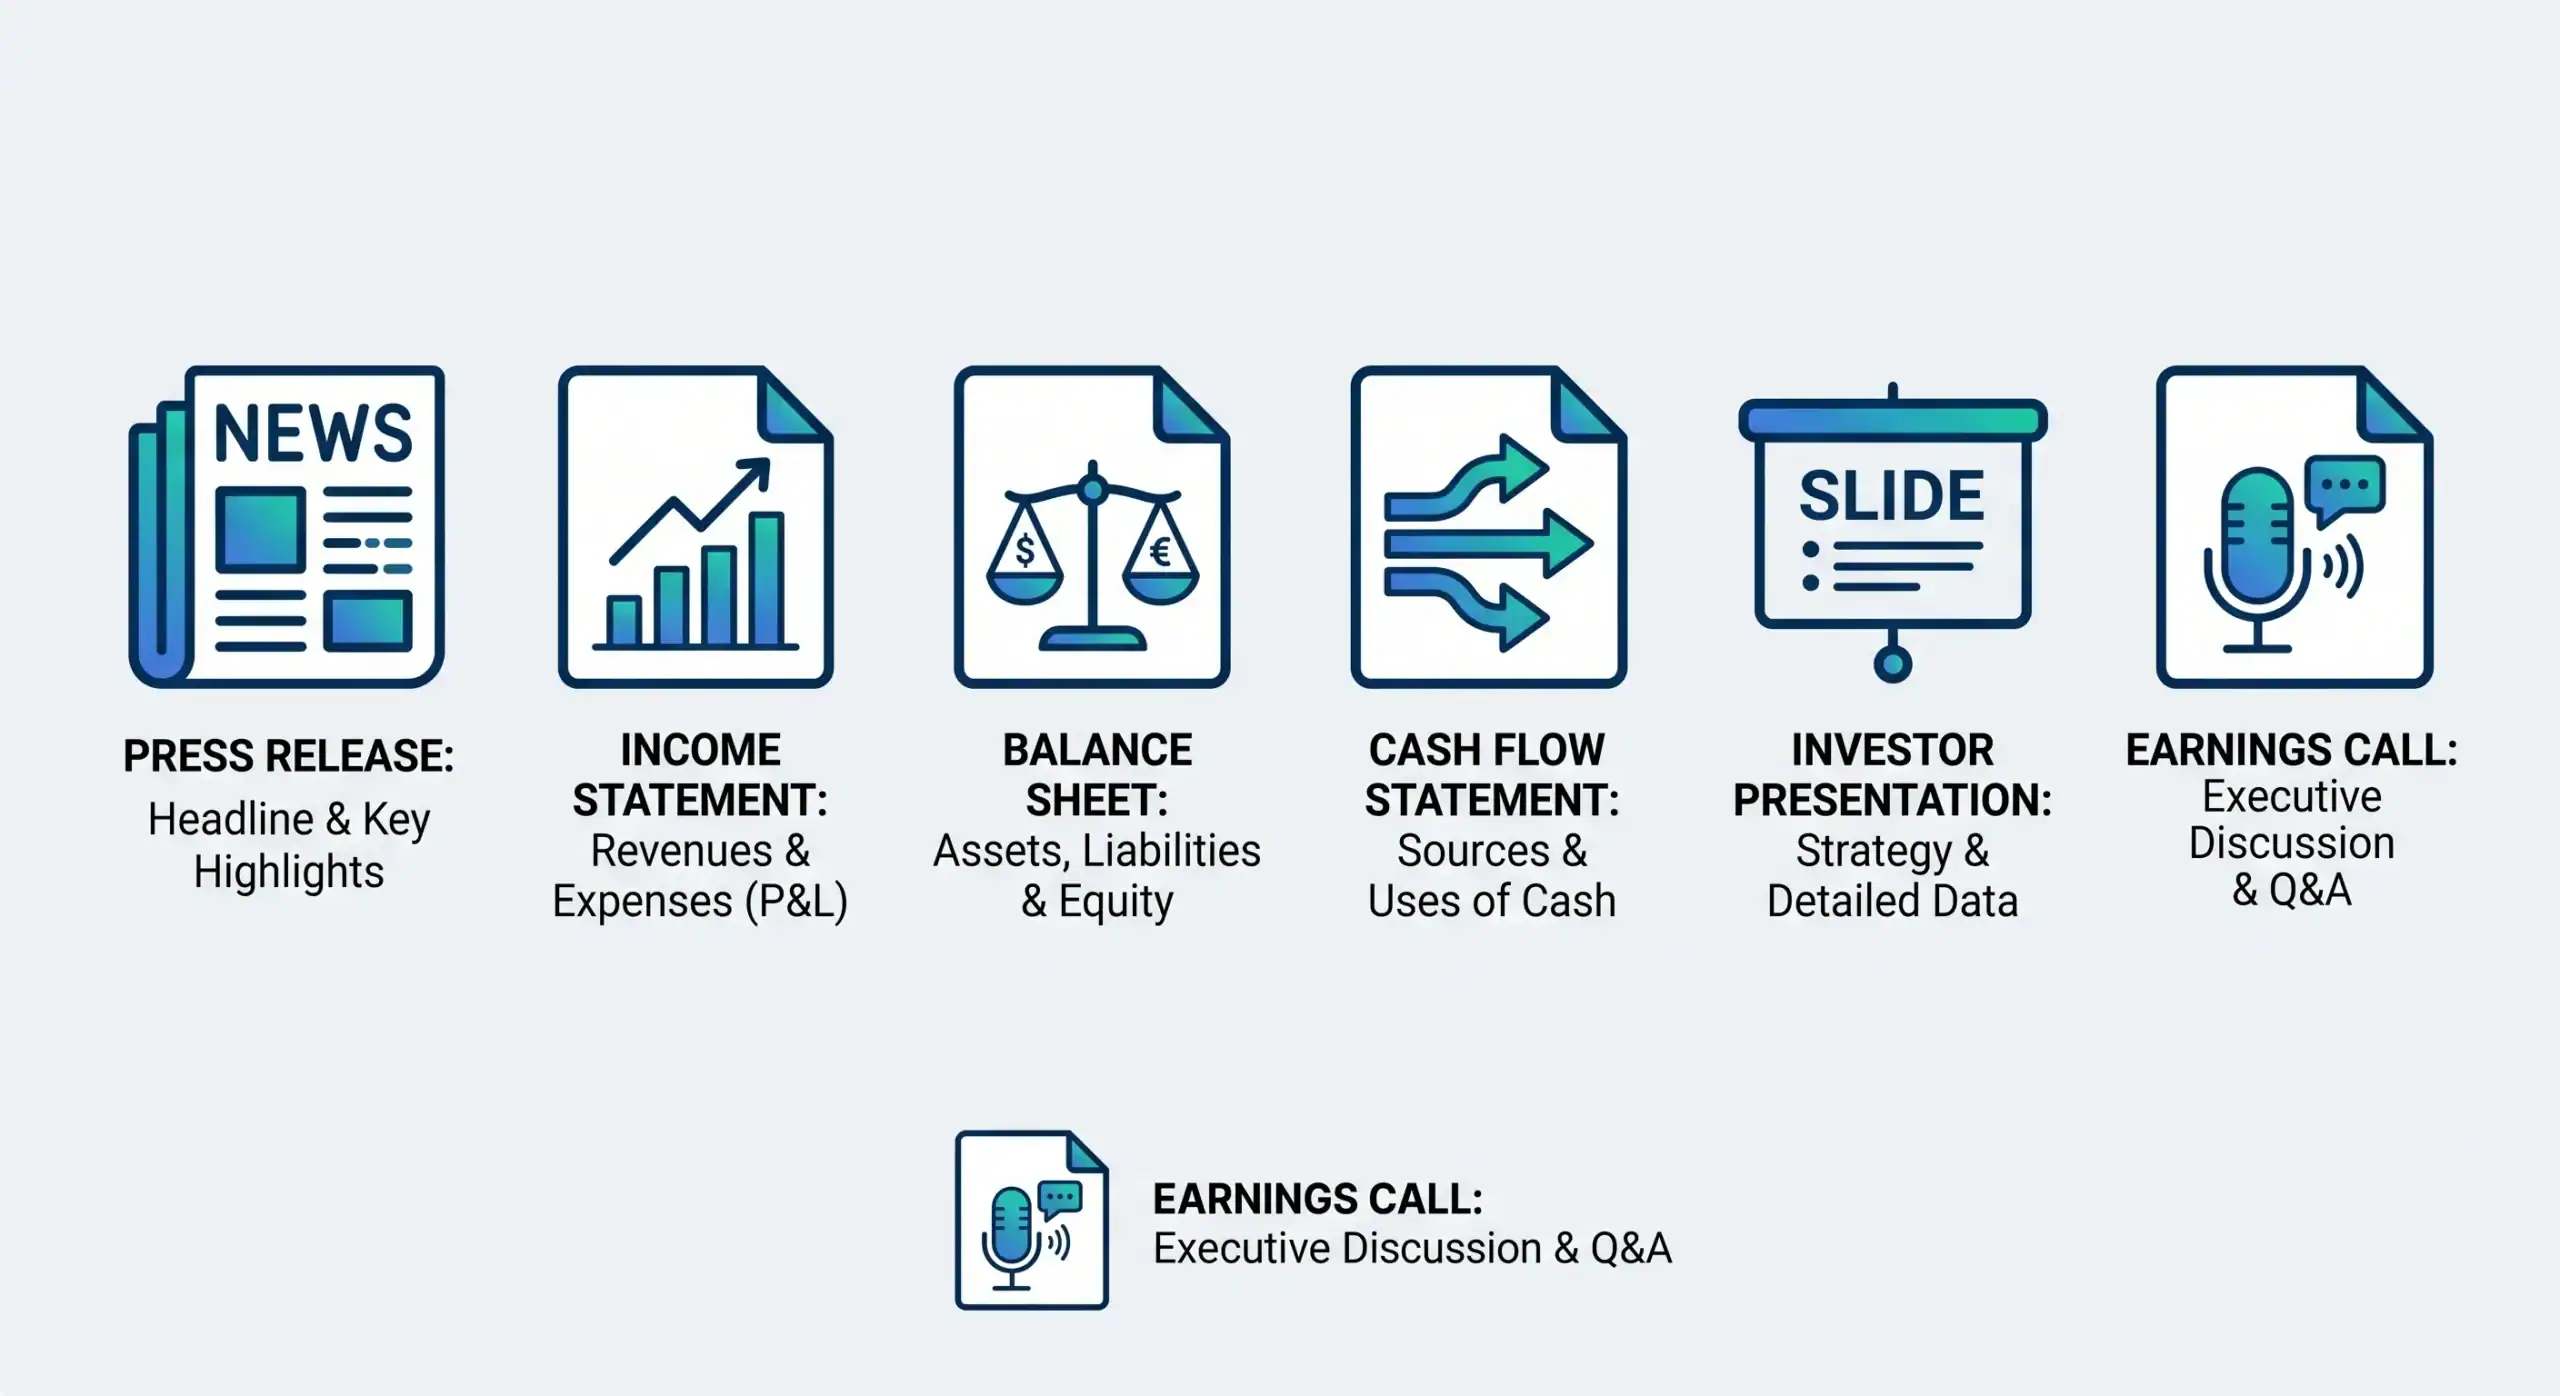
A complete earnings report isn't a single document, but rather a series of pieces released in stages. Understanding each one allows you to know where to find the information you need without wasting time on irrelevant details.
- Press release of results: The first document released, usually before the market opens or after it closes. It includes financial headlines, a summary table of the income statement, and statements from the CEO or CFO.
- Income statement (profit and loss statement): Revenue, costs, operating profit, net profit, and EPS. It is, by far, the most read document on the first pass.
- Balance sheet (balance sheet): Assets, liabilities and equity, key to assessing debt, liquidity and financial strength.
- Cash flow statement: Operating, investment, and financing cash flows. It is the most difficult document to manipulate in accounting, which is why many analysts review it with special attention.
- Investor presentation: The slides that the management team uses in the earnings call, with charts of quarterly evolution and operational metrics specific to the sector.
- Earnings call: The earnings conference with analysts and institutional investors, available in audio, video and transcript in the Investor Relations (IR) section of each company.
To access this documentation, the primary route is through the Investor Relations section of each company's website. US-listed companies also file their reports with the SEC, while Spanish companies file them with the CNMV; there are also specialized financial analysis platforms that aggregate this information. A practical reading order is to start with the press release to grasp the headlines, continue with the cash flow statement due to its lower potential for accounting manipulation, and use the investor presentation to understand the sector context.
EPS: the metric that most affects price in the short term
Earnings per share (EPS) is the company's net profit divided by the number of shares outstanding. It represents how much profit the business generates for each share issued, and it's the figure that grabs the most headlines on earnings day.
It's important to distinguish between two variations. Basic EPS is calculated by dividing net income by the number of shares outstanding at that time. Diluted EPS, on the other hand, divides net income by the number of shares outstanding plus those that could be issued through stock options, convertible bonds, or other similar instruments; it's the standard the market uses to compare between quarters and between companies because it reflects a more conservative scenario of potential dilution.
EPS is key in the short term because sell-side analysts publish their estimates before each earnings release, and the weighted average of those estimates forms the consensus: the benchmark against which the market measures actual performance. A positive EPS surprise is often the most immediate catalyst for a rally on earnings day.
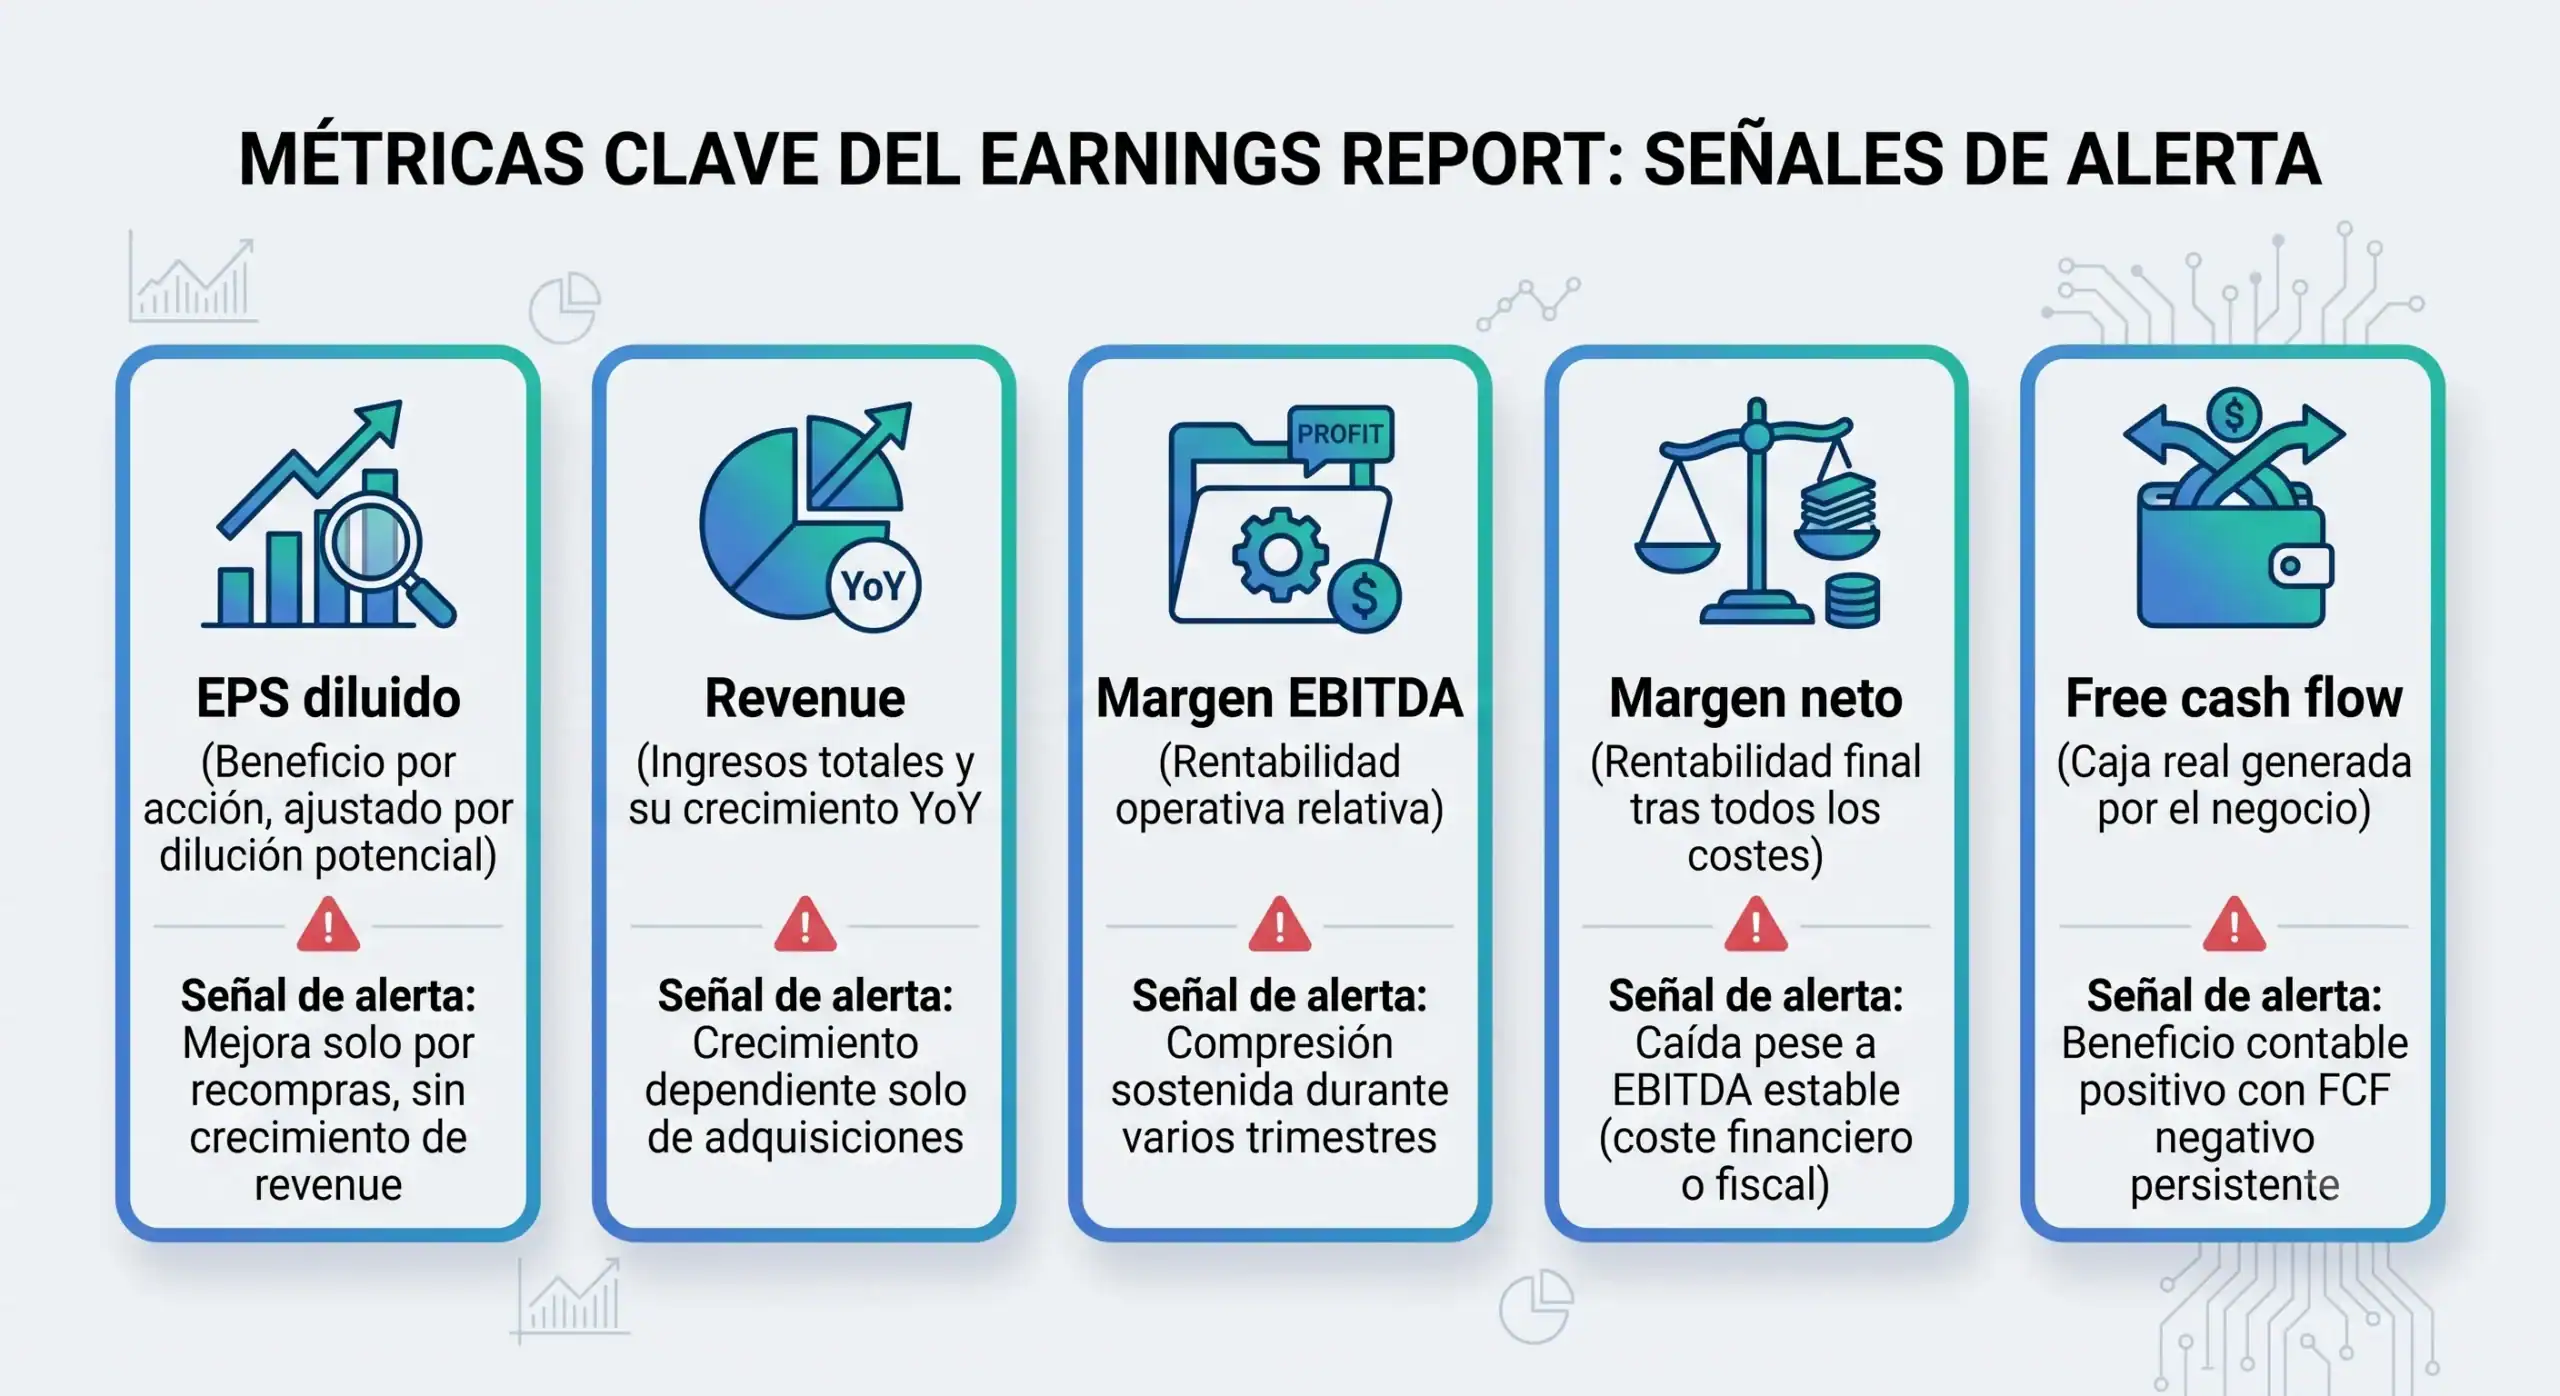
However, EPS has significant limitations as an isolated metric. It can be inflated through share buybacks, which reduce the number of shares outstanding—the denominator—without actually improving the business. It also doesn't reflect the business's cash generation, nor does it distinguish between recurring and one-off profits. That's why no serious analyst relies solely on EPS; they always supplement it with revenue, margins, and free cash flow.
Revenue, EBITDA, margins and free cash flow: analysis beyond EPS
This is the most technically dense section, and also the most valuable if you want to develop your own analytical approach. Each metric tells a different part of the business story.
- Revenue (total income) is the first line of the income statement, known as the "top line". Year-over-year (YoY) growth is the most direct indicator of business dynamism, and it's important to distinguish between organic growth—generated by the company's own operations—and inorganic growth, resulting from acquisitions. When a company breaks down revenue by segment or geography, this detail provides context about where it is actually growing and where it isn't.
- EBITDA (earnings before interest, taxes, depreciation and amortization) serves as a proxy for operating profitability before financing decisions and accounting criteria. The EBITDA margin, calculated by dividing EBITDA by revenue, allows for comparison of companies of different sizes and capital structures. An upward trend in this margin usually indicates improved efficiency; a sustained compression can be a warning sign that warrants investigation.
- Net margin, which is net profit divided by revenue, reflects the company's true profitability after all costs, interest and taxes, and is especially sensitive to changes in the cost of financing or the tax burden. In turn, the free cash flow (FCF) —operating cash flow minus capex, that is, investments in fixed assets— is the real money generated by the business that can be used to pay dividends, buy back shares, or reduce debt. Many analysts prefer free cash flow (FCF) to accounting profit precisely because it is much more difficult to manipulate; the FCF yield, which is calculated by dividing FCF by market capitalization, is also a common metric for relative valuation between companies.
A practical tip: Compare the evolution of each of these metrics over a period of at least four to eight quarters. An exceptional quarter without continuity is not the same as a structural improvement in the business, and only a time series allows you to distinguish between the two.
What is guidance and why can it move the price more than past results?
Guidance is a company's own forecast of its future performance, whether for the next quarter, the full year, or both. It can be quantitative, offering a numerical range of expected EPS or revenue, or qualitative, describing market outlooks or business trends without specific figures.
Guidance matters as much as, or even more than, published results because markets discount the future, not the past. A company can report excellent results and still see its stock price fall if its guidance disappoints; this is sometimes referred to in the market as a forward disappointment, distinct from a bad quarter itself.
There are three typical guidance scenarios. Conservative guidance, below the consensus, may reflect a deliberate strategy by management to set a low bar that will be easy to surpass in the following quarter. Guidance in line with the consensus is usually received neutrally by the market. Guidance above the consensus, on the other hand, is a positive signal that can trigger upward revisions by analysts, who adjust their models almost immediately upon receiving the new data.
When management reduces its guidance, it's important to pay attention to the specific nuances. A reduction only in the upper range, while maintaining the lower, is usually an ambiguous signal that requires further context. A reduction in the entire guidance without a clear structural justification is a significant negative signal, and the shift from quantitative to purely qualitative guidance—talking about "high uncertainty" instead of providing figures—usually indicates a loss of visibility into the business that the market doesn't tend to overlook.
How to read an earnings call: what executives say (and don't say)?
The earnings call is the results conference held after the press release, usually on the same day. It features the company's CEO and CFO, along with analysts from investment banks, and is available to all investors to watch live or access a transcript later through the Investor Relations section or specialized financial analysis platforms.
The structure is usually repeated quarter after quarter. For the first ten to fifteen minutes, the CEO and CFO present the results with their own narrative: this is where the framing the company wants the market to remember is established. Next comes the analyst question round, which can last between thirty and forty-five minutes and typically reveals the market's real concerns, both in the questions asked and in the answers—or lack thereof—received.
There are language patterns worth learning to recognize. Excessive use of conditionals like "could," "we expect that," or "if the conditions hold" in metrics that were previously communicated precisely can indicate reduced business visibility. Evasiveness during Q&A, when the CFO responds with something different from the question asked or constantly refers to "we'll give you the answer outside of the call," often betrays discomfort with that specific topic. A shift in emphasis compared to previous quarters—for example, if revenue was previously highlighted and now only margins are discussed—can signal a revenue slowdown that the team prefers not to focus on in their presentation.
The CEO's overall tone also provides qualitative information: comparing their level of enthusiasm to previous quarters can anticipate changes that the numbers don't yet fully reflect. And the questions from the most critical analysts often point to legitimate concerns shared by a large part of the market, so they deserve close attention. A practical tip is to read the transcript instead of just listening to the audio: it allows you to highlight passages and compare them with transcripts from previous quarters, something many financial analysis tools facilitate by allowing you to search for terms within the document.

Main Cryptocurrencies Course
Basic levelBit2Me Academy We bring you a new course where you will learn everything you need to know about the most important cryptocurrencies that exist today.
Empezar ahora ›How to integrate results analysis into your investment process?
Quarterly results aren't read to react to the next day's price, but to develop an informed opinion about a business's trajectory. Those who systematically read results develop, over time, an understanding of the company that someone who only looks at the stock price simply cannot achieve.
A practical framework for organizing that reading can be summarized in five steps:
- Review the press release: Does the result beat or fall short of the consensus in EPS and revenue?
- Analyze the evolution of margins: are they improving, remaining stable, or shrinking?
- Review free cash flow: Is the accounting profit supported by actual cash generation?
- Analyze the guidance: what does the company communicate about the next quarter or year, and how does it compare to the consensus?
- Reading or listening to the earnings call: what is the tone of the management team and what questions do analysts ask?
Applying this process quarter after quarter to the companies you follow is what transforms earnings analysis into a strategic advantage, not just a one-off exercise. Bit2Me With Invest, you can build and track your portfolio of funds, stocks, and ETFs directly from the app. Bit2Me, with access to the market information you need to apply this process on a recurring basis to the companies you already know thanks to Academy.

Frequently asked questions about how to read a company's quarterly results
What exactly are a company's quarterly results?
These are the financial reports that listed companies publish periodically—quarterly in the United States, with varying cycles in Europe—to show their income statement, balance sheet, and cash flows. They include documents such as the press release, income statement, and earnings call. Their publication is regulated by the relevant market supervisor, such as the CNMV in Spain or the SEC in the United States.
What is EPS in stocks and why is it so important?
EPS, or earnings per share, is the company's net income divided by the number of shares outstanding. It's considered so important because analysts establish a consensus estimate before the earnings release, and any surprises compared to that consensus are often the most immediate catalyst for price movement on earnings day. Even so, it's always advisable to combine it with revenue, margins, and free cash flow.
What is the difference between basic EPS and diluted EPS?
Basic EPS divides net income by the number of shares outstanding, while diluted EPS adds to the denominator the shares that could be issued through options, convertible bonds, or other similar instruments. The market typically uses diluted EPS because it provides a more conservative and comparable picture across quarters. The difference between the two can be significant for companies with many stock-based compensation plans.
How to interpret a company's guidance?
Guidance is the company's own forecast of its future performance, interpreted by comparing it to the prior consensus of analysts. Guidance above the consensus is usually a positive sign, guidance in line with it is received neutrally, and guidance below can be either a warning sign or a deliberate strategy to set a bar that is easy to surpass later. A shift from quantitative to qualitative guidance often indicates less visibility into the business.
What is an earnings call and where can I hear about it?
The earnings call is the company's results conference held after publishing its press release, featuring the CEO, CFO, and investment bank analysts. You can access it live or on demand, in audio, video, or transcript format, through the Investor Relations section of each company's website. Many financial analysis platforms also compile these transcripts.
What is the difference between EPS and revenue?
EPS measures the profit per share after deducting all costs, while revenue measures the company's total earnings before any costs, the so-called "top line." A company can grow its revenue and still see its EPS fall if its costs grow faster, or conversely, improve its EPS through share buybacks without revenue increasing. That's why both metrics are always read together, never in isolation.
What do analysts really look at in quarterly results?
Analysts compare EPS and revenue against consensus estimates, review the evolution of EBITDA and net margins over several quarters, and pay particular attention to free cash flow because it is more difficult to manipulate than accounting profit. They also analyze guidance against their own estimates and the tone of the management team during the earnings call. No serious analyst bases their interpretation on a single metric.
Is it safe to make investment decisions based solely on the earnings report?
Reading an earnings report reduces uncertainty, but it doesn't eliminate the inherent risk of any equity investment. Markets discount future expectations that may not be met, and no metric, however robust it may seem, guarantees subsequent price behavior. It's always advisable to contextualize a company's results within a broader analytical process and with a multi-quarter perspective.
How do quarterly results affect the share price?
The price reacts to the difference between the published results and the consensus expectation, not just the absolute outcome. A "beat"—exceeding estimates—usually pushes the price higher, while a "miss" tends to push it lower, although the magnitude depends on the level of expectation and the accompanying guidance. An excellent quarter with weak guidance can even cause the price to fall.
How can I start applying this analysis to my own portfolio?
The first step is to choose a small number of companies to follow quarter after quarter, applying the same five-step framework to each release: press release, margins, free cash flow, guidance, and earnings call. Over time, this habit builds a much stronger judgment than simply reacting to the day's headlines. Bit2Me Invest lets you track and manage your portfolio of funds, stocks, and ETFs from the same app. Bit2Me where you already track your crypto assets.


«Investment in cryptoassets is not fully regulated, may not be suitable for retail investors due to high volatility and there is a risk of losing all invested amounts»
Share this article!Continue learning

Investment strategy: what it is and how to create your own in 5 steps
Learn what an investment strategy is and how to create your own in 5 steps: objective, horizon, risk profile, DCA, buy-and-hold and index investing.
Invest in index funds, stocks, and ETFs from a single app
Discover how to invest in index funds, buy shares online and choose ETFs in Spain from a single app, with a comparative table of costs and taxes.

Crypto card in Spain: how it works and what you should know before choosing yours
Discover how a crypto card works in Spain: conversion when paying, regulatory framework, types, cashback, security and key criteria for choosing one.
Dividends and tax withholding: how much do you really keep?
Understand how the 19% withholding tax on dividends works in Spain, international double taxation, and how to recover the excess in your tax return.